Baking Science: Ingredients and Texture is often relevant when it’s able to help you understand and explain a given result. This is particularly useful when you want to know why your cake came out gummy in the middle, or why a given batch of cookies spread too much. Even more, this method is useful when trying to understand why a baked sheet lacks crispness, or when trying to explain why a given batch seems right but breaks when handled. An ingredient list alone cannot diagnose any of those outcomes. Texture is the result of the formula, mixing sequence and process, ingredient condition, deposited product geometry, applied heat history and cooling, and the environment created post-baking.
Quick answer: Start with the symptom related to texture, along with at least one formulation hypothesis and one process hypothesis. Choose an observation that provides a way to distinguish between the two hypotheses, conduct an experiment around the one specific question, and note the method of measurement and the results. This approach is more effective than attributing every problem to a single ingredient.
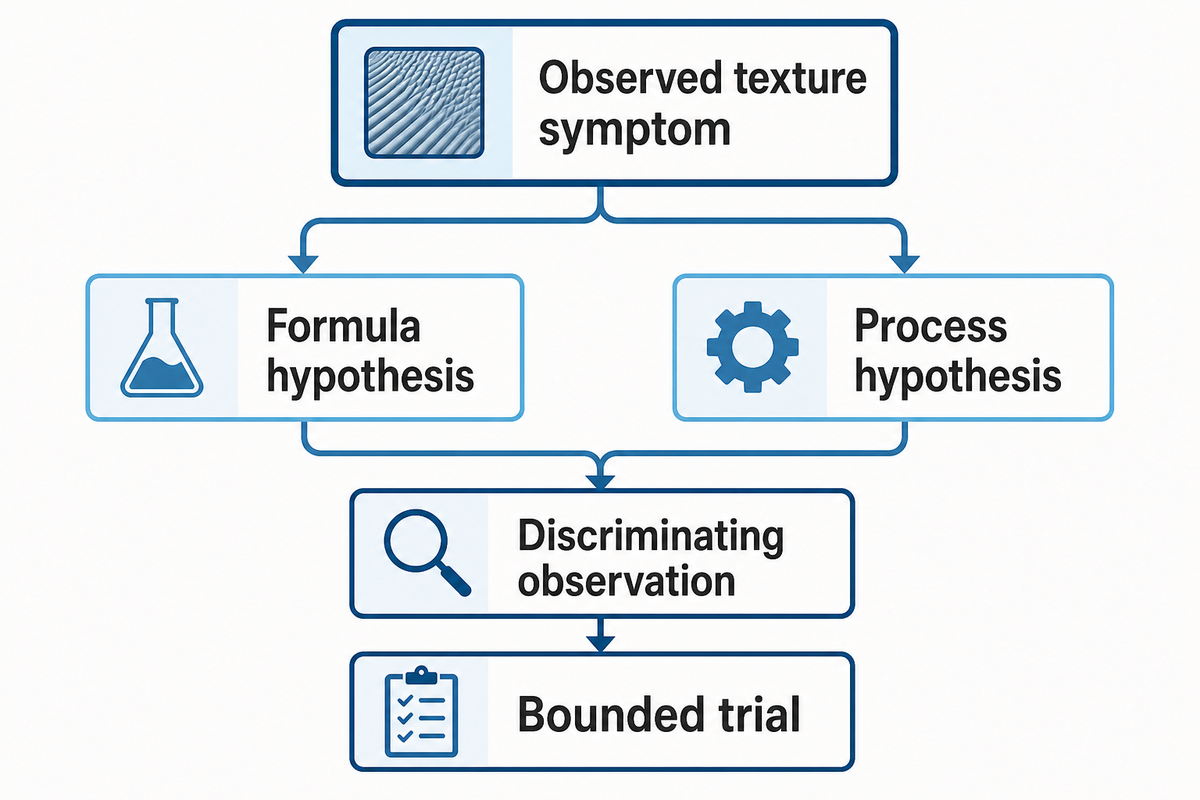
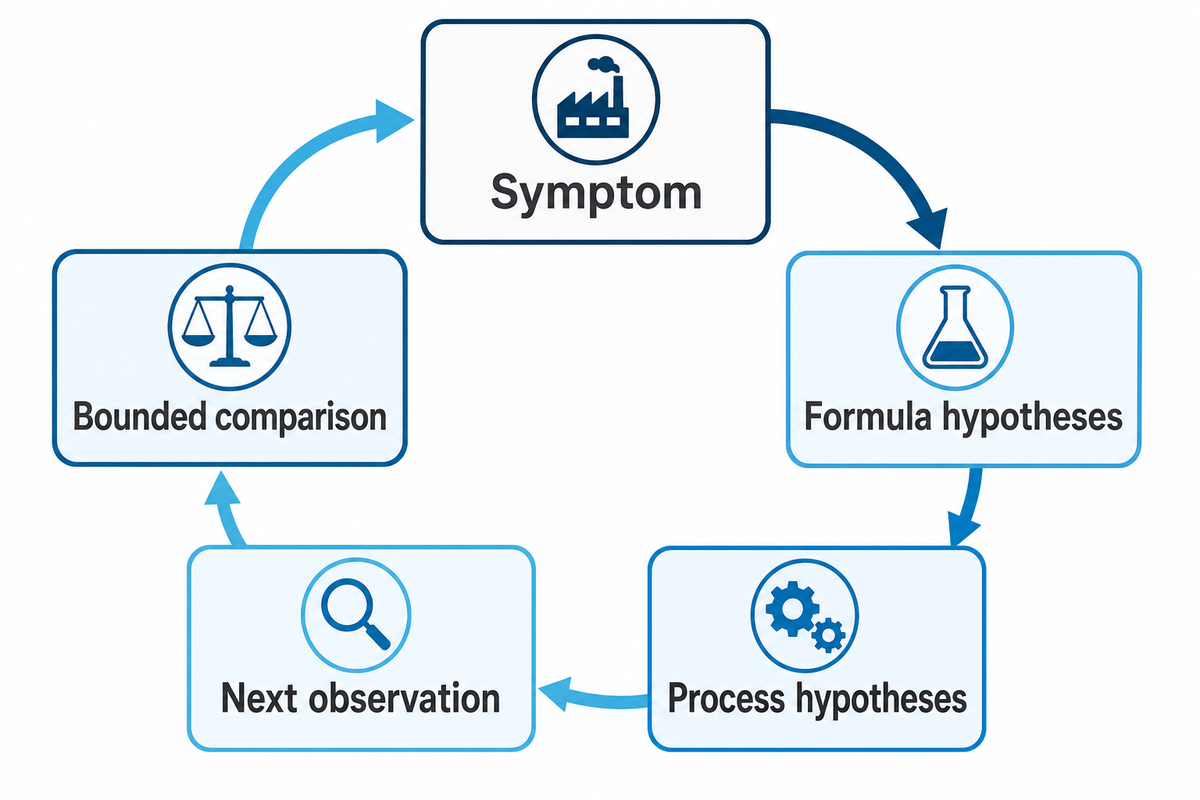
Texture Diagnosis Loop
Symptom → competing hypotheses → discriminating observation → bounded trial → repeat evidence → production-system review. Failure to include any link turns a plausible answer into an unsupported conclusion.
Start with a texture symptom, not an ingredient list
One given texture problem rarely corresponds to only one ingredient. First identify the product and the symptom. Next, record the formula revision, mixing condition, geometry, bake profile, cooling, and package context before changing the recipe. The goal is to analyze many factors and competing explanations, not guess which ingredient is “bad.” In a production batch, compare the failed sample with the approved reference under the same formula, process, geometry, cooling, and measurement conditions.
For example, assume a sample is denser than expected. One possible explanation could be that there was too little gas. However, that isn’t the only possible explanation. Gas could have been produced and escaped. Structure may have set too late, deposited mass or geometry may have changed, mixing may have removed incorporated air, or the thermal profile may have shifted. Each of these explanations could account for the low volume, but each would warrant a different follow up check.
“Add more water” is not a diagnosis. Dryness may follow high bake loss, a thin geometry, a damaged emulsion, a cooling delay, or moisture movement during storage. Total moisture, water activity, mass loss, and sensory dryness describe different parts of the problem. First, state the problem in a way that’s easy to observe, like where the problem is located and when it occurred and what the difference is from the accepted standard.
A structured listing of ingredient functions, after defining the symptom, can be facilitated by the baking ingredient function framework. Keep the logic clear: the symptom drives the hypothesis, while an ingredient function doesn’t resolve the hypothesis.
Build a function map before changing the formula
Map ingredients according to the functions they perform in the actual product. Flour, water, sugar, fat, eggs, salt, acids, and leaveners can influence more than one response, so changing one amount may alter structure, moisture behavior, aeration, spread, color, flavor, and setting together.
Flour is not merely “structure,” and sugar is not merely “sweetness.” Flour brings proteins and starch into a water- and heat-dependent system. Sugar changes the dissolved phase as well as sweetness and can affect spread, water behavior, and browning. Fat can perform multiple functions through lubrication, tenderness, flavoring, aeration, or emulsification, depending on its state and the mixing method. Eggs introduce water, proteins, lipids, and emulsifying components. Chemical or biological leavening can create gas and space, but a product still requires a structure that can retain gas until it sets.
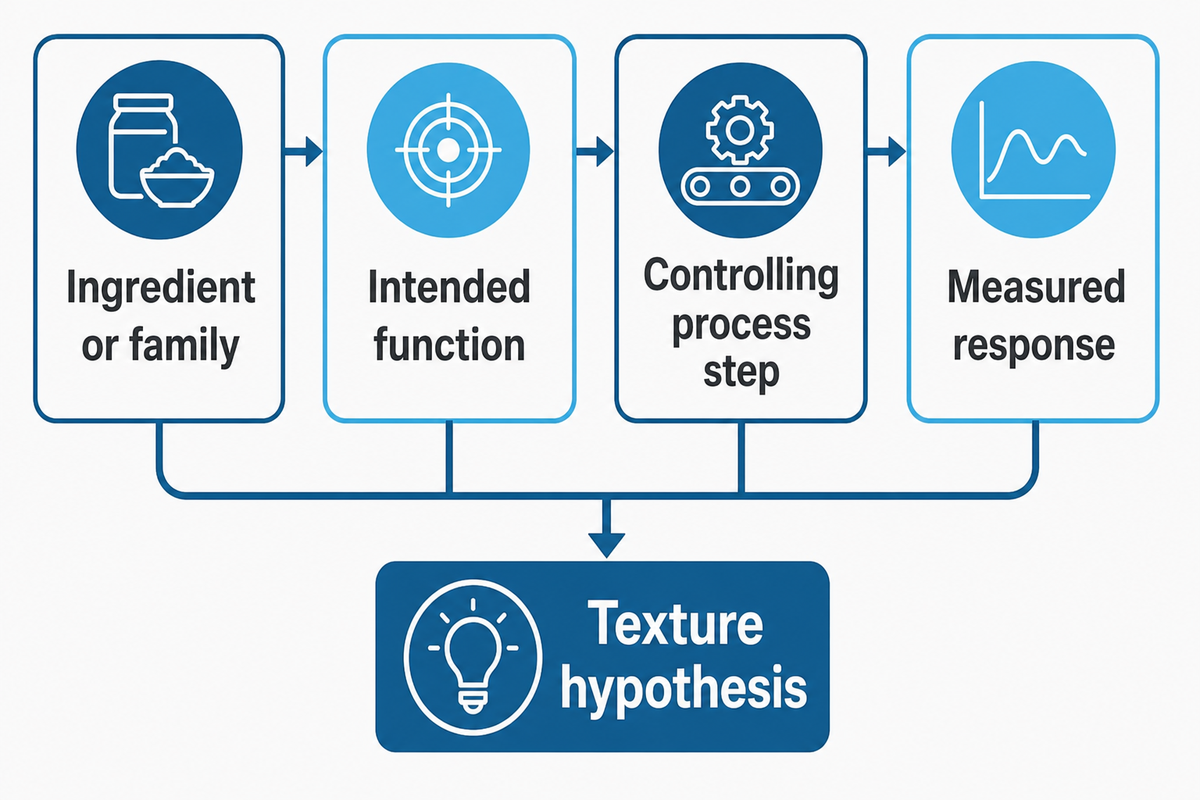
Use a four-column function map: ingredient or ingredient family; intended function in this formula; process step that activates or controls that function; and response that will be measured. This approach ensures that substituting an ingredient is not treated as a one-dimensional swap. Different flours, sugars, fat systems, and egg replacements may affect many related factors, even when their weights appear to be comparable.
This is a troubleshooting frame, not a second ingredient dictionary: the separate ingredient-functions reference owns stage-by-stage role education, while this map exists only to form and test competing texture hypotheses.
The baking variable interaction planner (planning worksheet) can be used for more detailed planning. It is used prior to a trial, as it can identify coupled factors that a simple side-by-side comparison could miss.
How common baking ingredients inform texture diagnosis
The science behind baking is often summed up as “baking is a science.” This statement only holds true when the science of baking provides an explanation that can be subject to testing. Food science and the chemistry of baking study how different ingredients behave under given conditions. Becoming a better baker or product developer does not require memorizing one effect for every ingredient. It’s about relating baking ingredients, ingredients and techniques, and the baking process to measured texture and flavor.
Ingredient roles translated into texture-diagnosis questions
Function family
Terms you may see
Question to record
Flour and structure
Different types of flour, including all-purpose flour and cake flour, differ in more than a name. Flour is made from milled material whose protein content, starch, particle properties, and gluten-forming potential matter among the dry ingredients.
Which type and quality were used, and how did hydration, mixing, liquid and heat change the structure?
Sugars
White sugar, brown sugar, molasses, and sugar crystals are not interchangeable labels. Sugar adds sweetness, yet each type of sugar can also change dissolved solids, acidity, browning, spread, water behavior, and unique flavor.
When a recipe calls for a sugar, record the type and amount rather than assuming sugar and brown sugar create identical flavor and texture.
Fats and flavor systems
Unsalted butter, other fats used in baking, and a finished buttercream serve different purposes. Creaming butter and sugar may support aeration, while pastry formulas may prioritize lamination or tenderness.
Is the fat meant to aerate, lubricate, carry or add flavor, tenderize, or support an emulsion?
Eggs and foams
Eggs in baking contribute water, fat, protein, and emulsifying components. Egg whites, yolk, or separated yolks and whites can be handled differently. Whipping egg whites with an acid such as cream of tartar is relevant to meringue, not a universal instruction.
Did separation, temperature, whipping, sequence, or shear create different foam and setting behavior?
Leavening systems
Baking soda and baking powder are chemical leaveners, while yeast is biological. A formula may use buttermilk or other acidic ingredients mixed with baking soda. When a leavening agent releases carbon dioxide, gas is present, but that alone does not make baked goods rise and stay light and fluffy. Yeast in bread presents a different timing question.
Which leaveners were present, when was gas generated, and could the mixed mass retain it until setting?
Product context
Simple ingredients can create different outcomes. Chewy cookies, baking bread, carrot cake, a crisp wafer, and a tender cake call for different structures even when they share essential baking ingredients.
What target texture and taste define an acceptable baked good, and which reactions in baking are important in baking that product?
No amount of quality ingredients can compensate for an uncontrolled method. High-quality ingredients cannot rescue an uncontrolled method, and the correct ingredients cannot be selected without a target. Record the ingredients and the role assigned to each, then consider what happens when you combine those ingredients. A lot of recipes call one material a staple ingredient, but that label does not reveal its coupled effects. When baking ingredients work as a system, ingredients like flour, sugar, fat, eggs, liquids, and leaveners may provide baked goods with several linked effects. Interpreting those coupled effects requires the right question, not a culinary school slogan. No table can guarantee that you will achieve the perfect result: the type and amount, process history, and measurement method determine whether those properties match the reference.
Structure failures: flour, proteins and starch setting
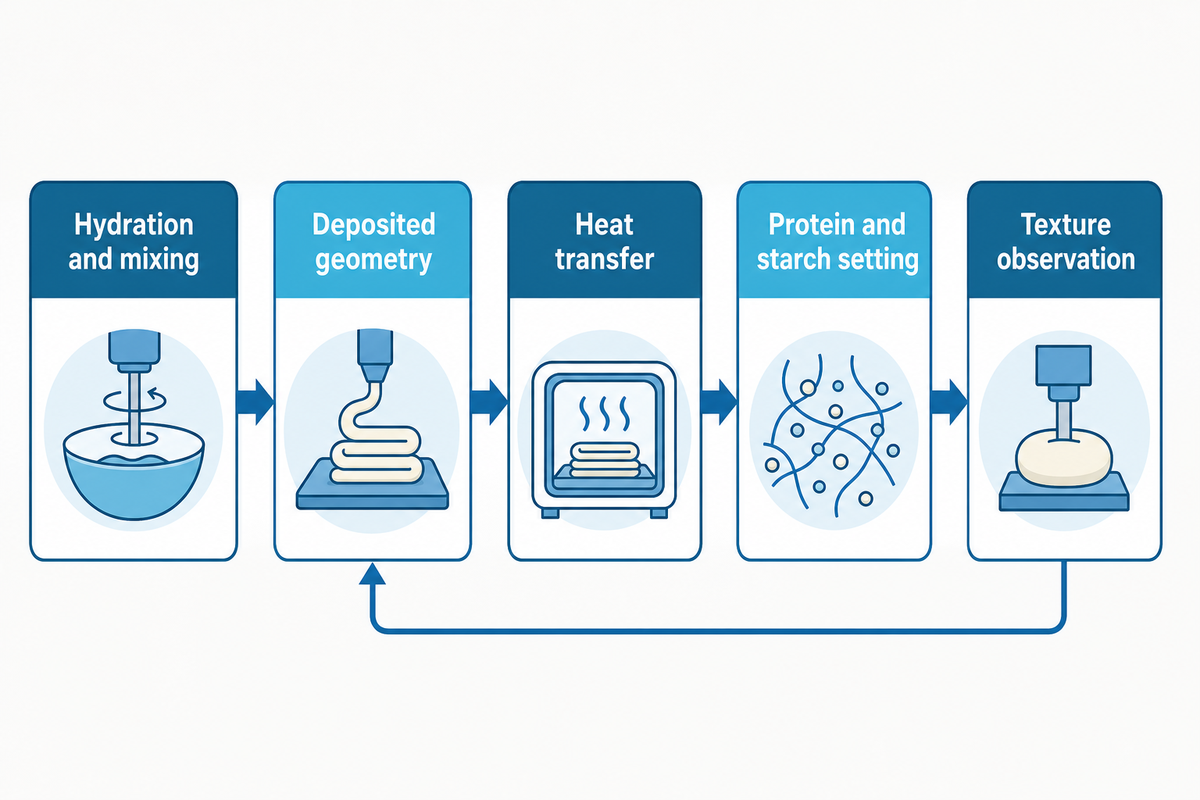
Structure forms through hydration, mixing, gas-cell behavior, starch changes, protein setting, and heat transfer. A tough, compact, weak, or gummy crumb can therefore come from different combinations of formulation and process. Analyze the entire process and not only the flour label. In production, this problem requires a geometry and heat-profile comparison because deposit depth and shape can change how the center and surface set, even when the formula is unchanged.
Start by looking at what happened before the oven. Was the temperature of the ingredients close to your reference temperature? Was the time for hydration the same? Did you change the sequence, the speed of the mixer, or the point at which you stopped mixing? Take a look at the geometry and the method of baking. Deep deposits and thin sheets do not experience the same heat path. Even with an unchanged recipe, a shift in the mass, shape, pan, or contact surface may change the balance between the drying of the surface and the setting of the center.
Don’t use one texture word as if it were a standardized measurement. “Firm,” “tough,” and “chewy” may describe sensory impressions, instrument outputs, or both. Record the method: who assessed the sample, at what age and temperature, at which location, with what compression or break test, and against which reference. The texture planning page can help separate target language from measurement language before results are compared.
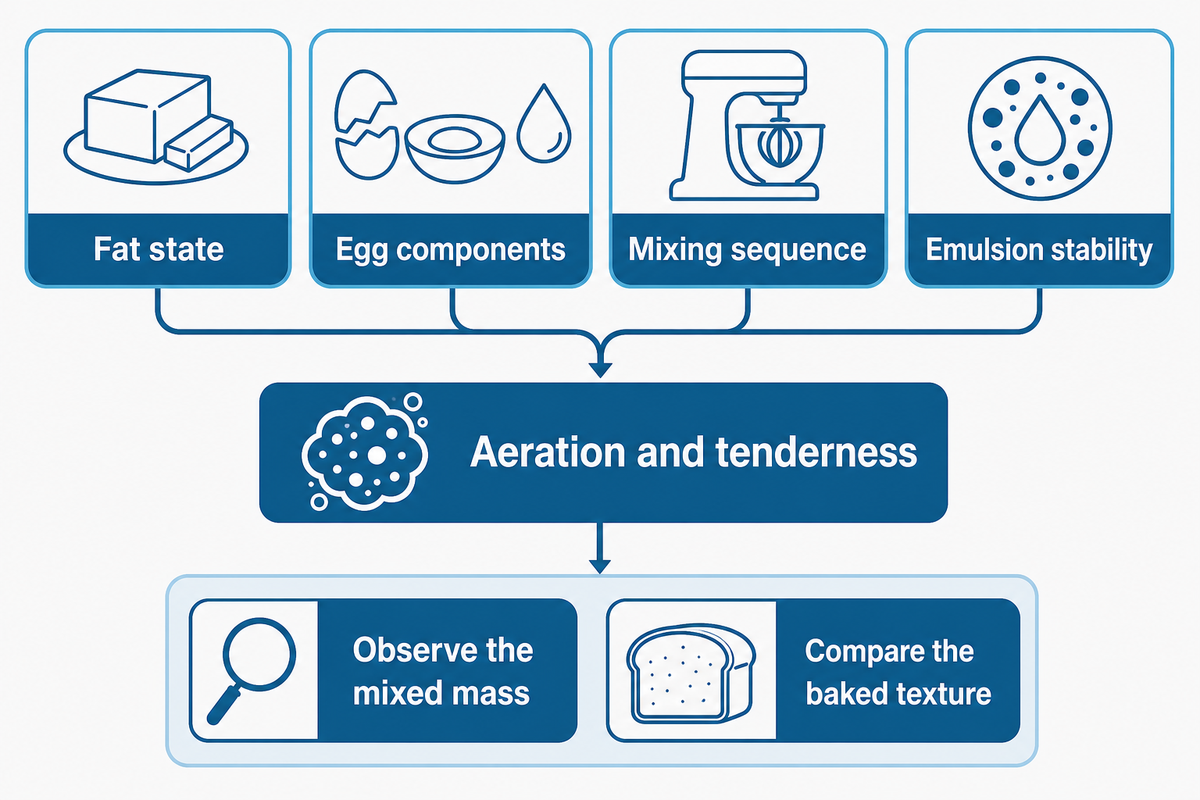
Tenderness and aeration: fat state, eggs and emulsion stability
Fat and egg components affect texture by several mechanisms which include lubrication, aeration, distribution of water, emulsification, and protein set, among others. Their effect is a function of state, temperature, sequence, shear, and the rest of the formulation. Thus, a change in weight only may not account for the result obtained.
Creaming a plastic fat with sugar is not the same operation as blending a liquid oil; one may create and stabilize an aerated phase under suitable conditions, while the other may primarily change lubrication and flow. Egg temperature and addition sequence can change how readily a mixture stays uniform. Even if the emulsion breaks, the mass subsequently deposited may appear to be acceptable in the bowl, but may bake to yield irregular cells, greasy areas, or sections that aren’t evenly tender.
When a reduced-fat formula fails, don’t automatically add one replacer and conclude that the function has been restored. Determine what function was lost. Was the missing response aeration, lubrication, water distribution, flavor release, structural timing, or more than one? Describe the appearance of the mixture, along with any density that might be relevant, and relate that to the final texture. Visual stability offers evidence, but isn’t definitive proof that every later response will match.
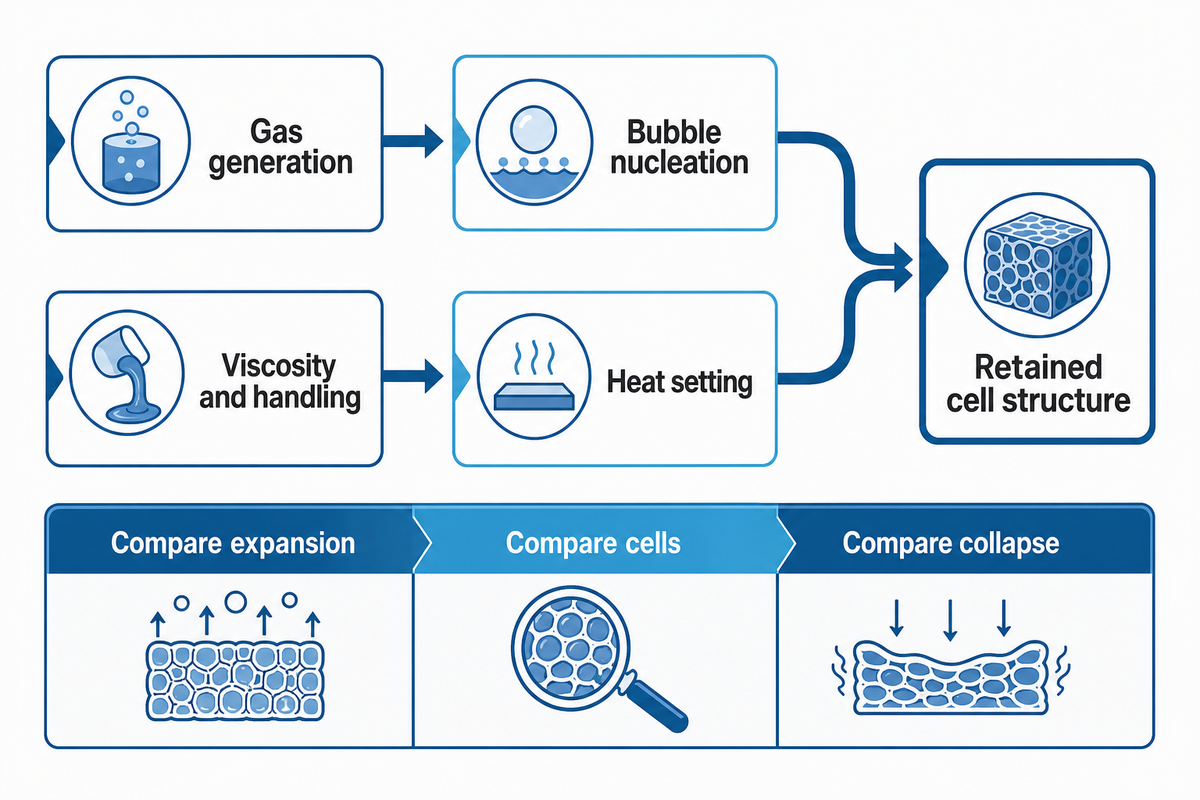
Volume and cell structure: gas generation versus gas retention
Generating gas doesn’t ensure retained volume. Leavening may produce gas, yet final cell structure also depends on nucleation, viscosity, mixing, deposit handling, expansion timing, and when starch and proteins set. Both the gas-generating system and the structure that needs to retain it must be evaluated. In production, this failure matters because gas generation and structure setting can drift apart.
This is why increasing leavener can be disappointing. Adding more gas at the wrong time can cause gas to escape, merge cells, distort the surface, or outrun a forming structure. On the other hand, a low-volume batch could indicate poor aeration or handling, even when the chemical reaction is adequate. Evaluate mixed-mass density, deposited shape, oven rise, final height, cell distribution, and collapse post-baking. Don’t solely base your evaluation on final height.
Acid balance, type of leavener, particle distribution, and holding time can all be important, but the effect and extent are formula specific. Controlled studies should not mix a leavener change with a new flour batch, a change in the mixing endpoint, and a change in deposit weight unless the study intentionally evaluates the effect of these changes.
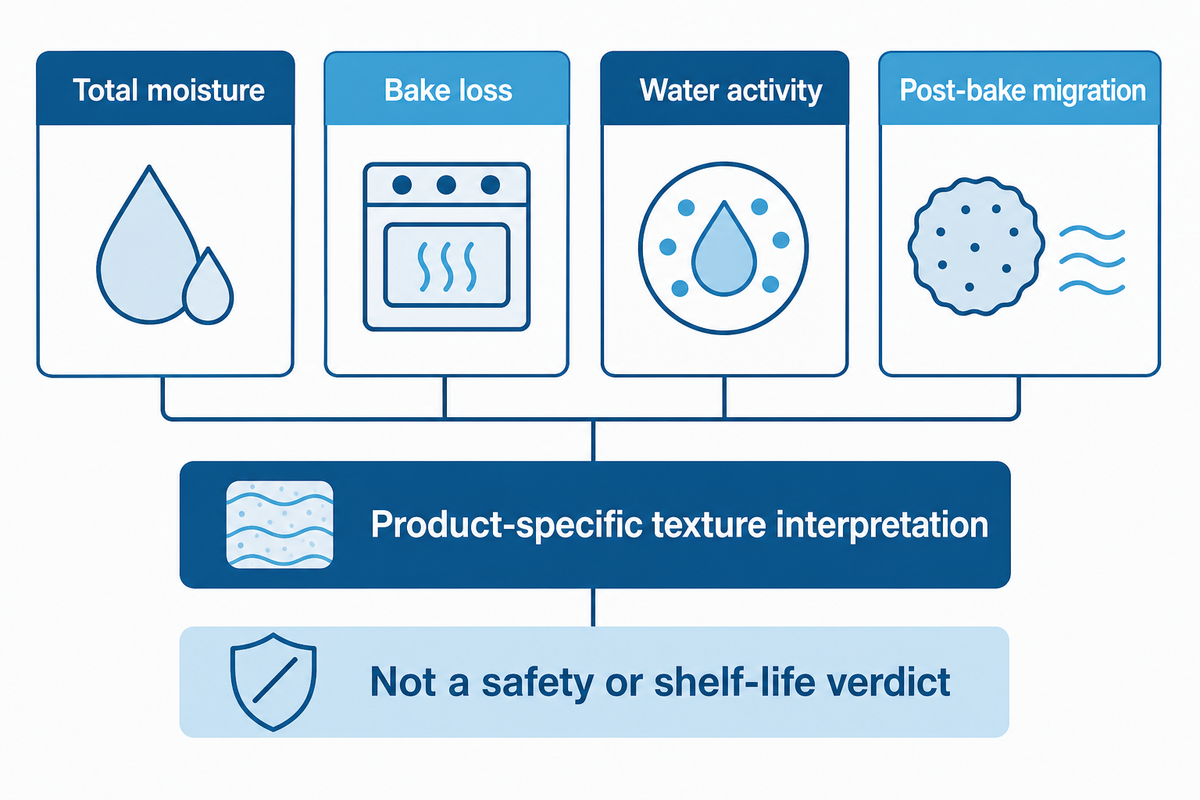
Moisture symptoms: measure availability, loss and migration separately
Total moisture, bake loss, sensory dryness, and water activity are not interchangeable. Water activity describes the equilibrium vapor-pressure behavior of water in a food. Humidity can affect moisture content, but use a method suited to the decision and control sample conditions. Don’t draw conclusions about product safety or shelf life from one texture-oriented reading.
The US Food and Drug Administration defines water activity as the ratio between a food’s vapor pressure and that of distilled water under the same conditions. The same guide also explains that some water is strongly bound and does not behave like freely available water. In the same technical guide, water activity is related to equilibrium relative humidity divided by 100. The reason why two products that contain the same total moisture can act differently becomes clear from these definitions.
Measurement conditions are part of the result. FDA gives an example in which a 1°C difference between the sample and the air above it could shift the reported water-activity reading by about 0.05. That is a metrology warning, not a specification for your product. Let the sample equilibrate according to the instrument method, control temperature, use reference or calibration checks, record sample location and age, and take representative repeats when the product is heterogeneous.
Figure out the critical crispness limit for the specific product. A study on low-moisture cookies illustrates how one team identified a critical water-activity region for a specific product and method; the study reports funding from instrument vendor Decagon Devices, Inc., and its result does not provide a number to transfer to bread, cake, wafers, or another cookie formula. The cooling time, air exposure, fillings, coatings, and packing can all contribute to the moisture level after baking. Record when the symptom occurs. A product that comes out crispy from the oven but softens later, and a product that never crisps up, present different situations to investigate.
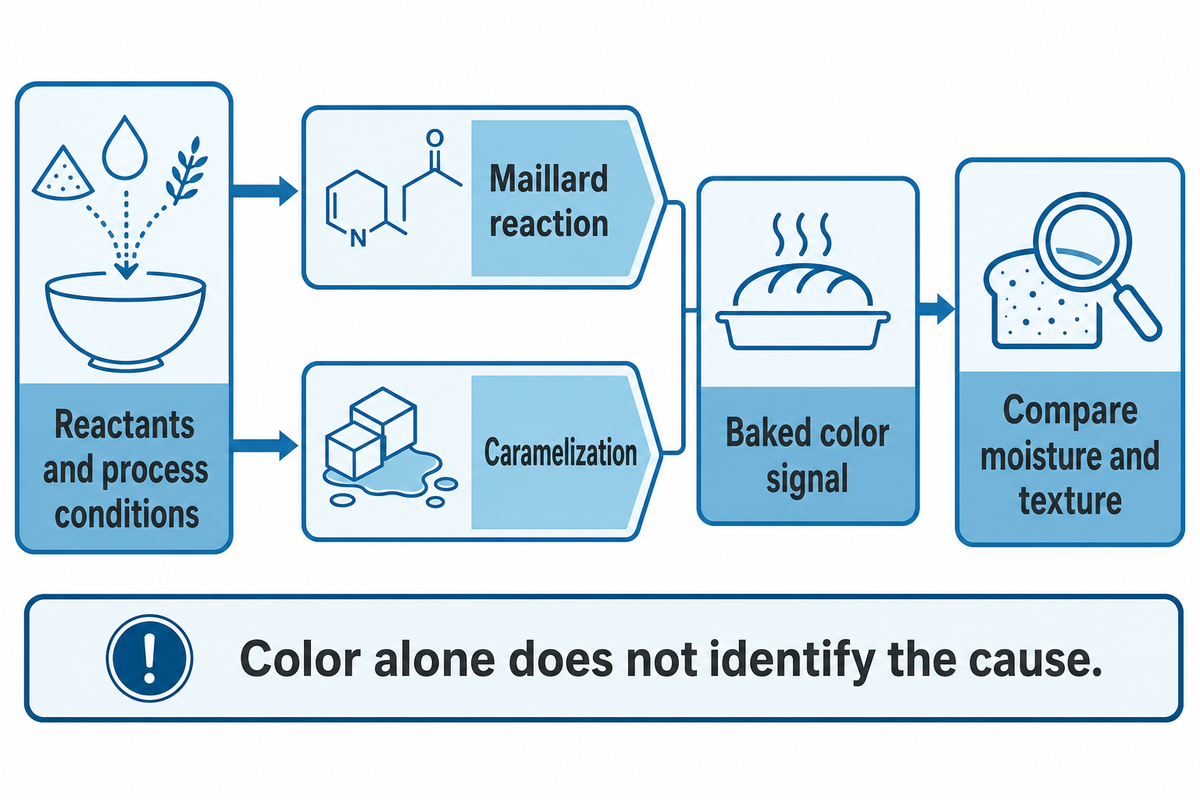
Color is an outcome signal, not a single-reaction label
Baked color may reflect more than one process. Maillard reaction and caramelization are distinct forms of non-enzymatic browning, and their contribution depends on reactants and process conditions. Darker color by itself neither explains the cause nor confirms that the internal texture is correct. In production, a color problem matters because the surface and center can follow different heat histories.
A 2025 peer-reviewed review describes amino compounds and reducing sugars as central reactants in the Maillard pathway and discusses the influence of temperature, time, water activity, and pH. It also treats caramelization separately. That distinction matters when troubleshooting: changing sugar type, protein sources, pH, surface moisture, or thermal exposure may shift color by different mechanisms.
Color should be used as a recorded response along with other context. Take a photograph or measure the same region under the same lighting conditions and note the surface and interior results along with mass loss and texture. Avoid a “browning temperature” as there are real differences in formulations, surfaces, and heat histories. Color should be treated as one of the many clues found in the evidence and not as a definitive diagnosis.
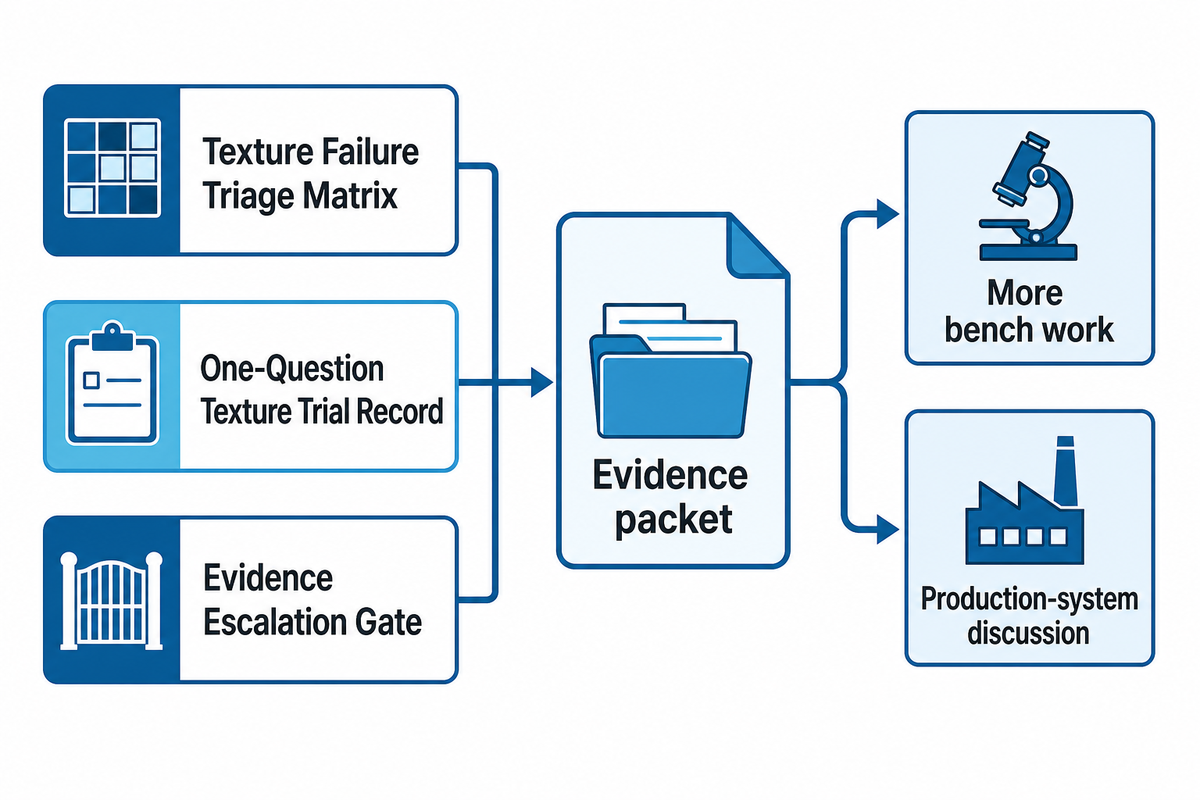
Texture Failure Triage Matrix
The Texture Failure Triage Matrix maintains multiple possible causes in view until measurement allows elimination. Each row combines formulation and process hypothesis pairs with subsequent observation and bounded comparison. The matrix is used to structure an investigation and doesn’t assign a universal cause or solution.
Texture Failure Triage Matrix
Observed symptom
Formulation hypotheses
Process or handling hypotheses
Next discriminating observation
Bounded comparison
Dense or low volume
Gas system, hydration, viscosity, structural balance
Surface preparation, deposit, contact time, release timing
Location and timing of adhesion, surface condition, residue pattern
Hold formula first; compare the suspected surface or timing variable
The matrix is best understood through an example. Let’s say loss of crispness occurs only in the post-fill and post-pack stages. The first meaningful comparison could hold the baked shell constant and vary one defined assembly or packing condition. If the product is already soft upon removal from the oven, that test addresses the wrong concern. Product development proposes hypotheses, quality defines the response method, production records lot and shift context, and the plant manager decides whether the evidence is relevant to the operating system.
Design a comparison that can answer one question
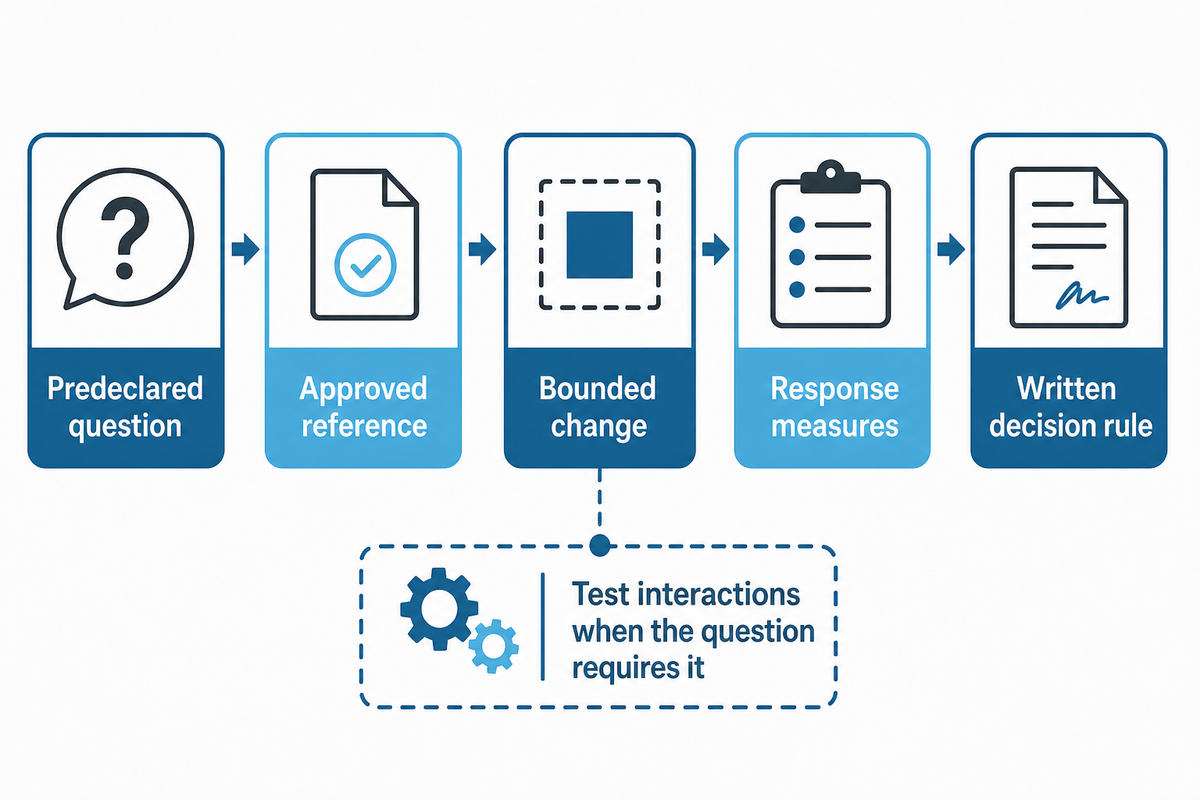
Useful baking trials have a predeclared question, an approved reference, a bounded intended change, recorded nuisance variables, repeatable response measures, and a written decision rule. “One question” doesn’t signify that one factor at a time is always sufficient; interaction questions require an interaction-centered design.
NIST cautions against one-factor-at-a-time testing as it fails to evaluate the interaction of multiple factors.
“The OFAT approach does not take interactions into account.”
If an interaction is suspected between fat system and mixing, changing these factors in an unrelated sequential batch wouldn’t be adequate to evaluate this interaction. To reliably assess this, a planned factorial or another appropriate design should be used along with requisite levels of randomization, replication, and blocking. Choose the repeat count and acceptance tolerance from the product, risk, method capability, and decision consequences; this guide does not invent universal values.
One-Question Texture Trial Record
Field
What to record
Worked example, not plant data
Decision question
One outcome the design must resolve
Does the revised cooling condition retain the reference break response at the planned evaluation time?
Same mixed batch, deposit specification, bake run, and package material
Design and repeat boundary
Randomization, blocking, replication, sample unit, and excluded conditions
Predeclared sequence and sampling across relevant positions
Response measures
Method, location, age, temperature, operator, and reference checks
Break response plus sensory comparison at the declared evaluation time
Acceptance window
Approved decision rule and owner
Use the product team’s approved window; no generic value
Result and next action
Observed evidence, deviations, uncertainty, and disposition
Repeat, refine the design, reject, or advance to production-system review
The production trial measurement builder can help organize the response-method portion. It does not select the correct method or acceptance range for you.
What a 2025 pound-cake study can and cannot tell you
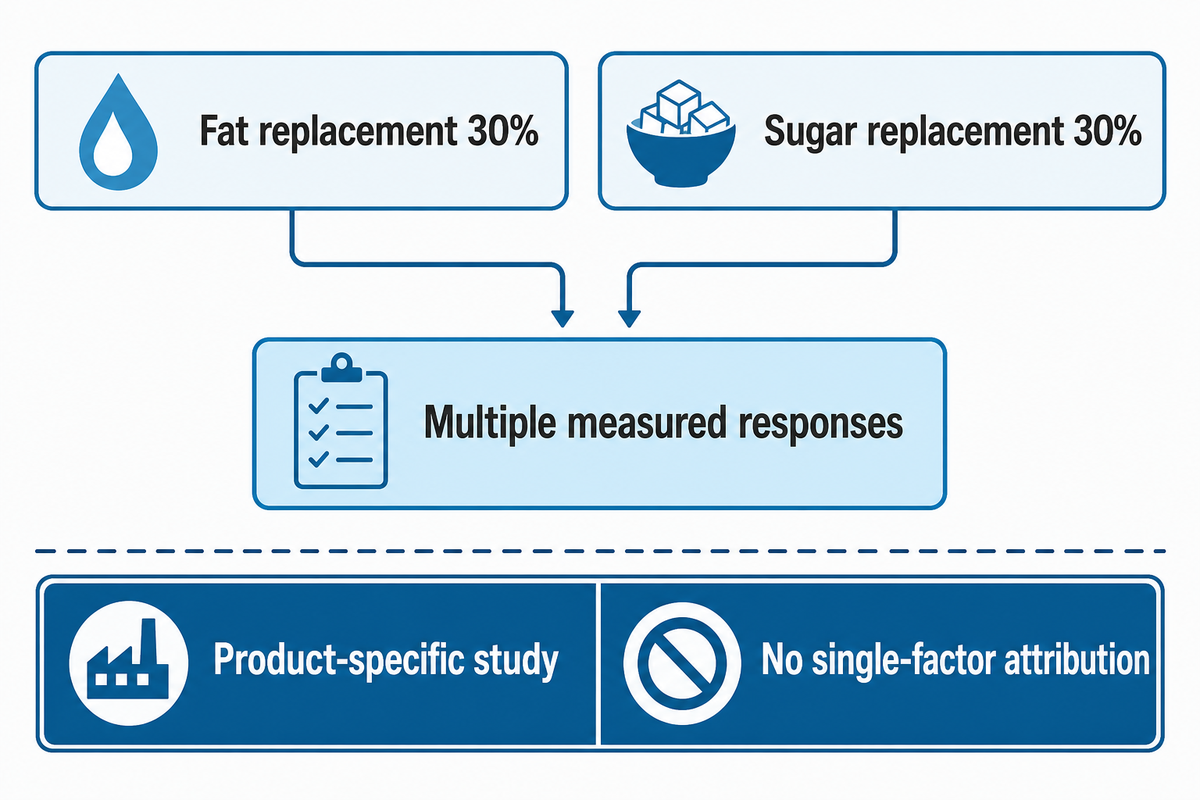
A 2025 pound-cake study is appropriate here because it measured various results following a coupled reformulation. It isn’t a general recipe. Its procedure contained simultaneous 30% fat replacement with dietary fibers and 30% sugar replacement; therefore, the result can’t single out an effect for a particular component or anticipate another product. Do not treat the study as factory validation or inspection evidence, and do not claim measurement precision for another product.
In the peer-reviewed study, researchers looked at the effect of varying pound-cake formulations on the physicochemical properties and the sensory responses of consumers. Practically, the case shows that a reformulation can affect more than one response and that a convincing decision needs more than height, color, or one texture number.
Keep the boundary equally visible. Pound cake isn’t a cookie, bread, thin wafer, egg roll, or filled crisp snack. Nor does the study validate equipment, food safety, shelf life, or production transfer. Because two major formula dimensions changed together, it also doesn’t prove which change caused which result. Use the paper as a model for bounded, multi-response evaluation, then build a design for the actual product and question.
Decide whether the evidence is ready for production transfer
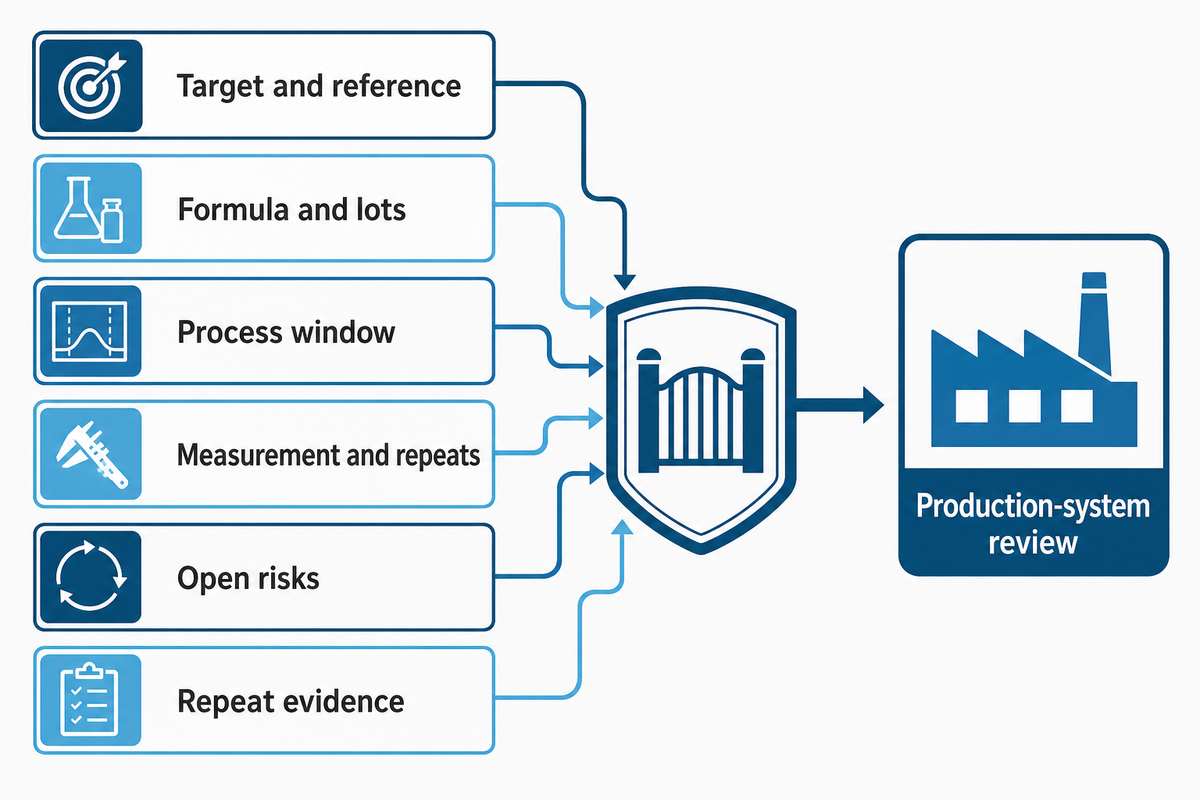
Bench evidence is ready for a production-system review only when the target texture, reference, formula, ingredient-lot boundary, process window, measurement method, repeat evidence, and unresolved risks are documented. Passing this gate doesn’t ensure that scale-up will maintain texture, or that equipment is adequate.
According to Oklahoma State University, scale-up requires consideration of possible texture changes. Surface-area-to-volume differences affect mixing and heating. A larger batch is more than just an idea of a larger quantity. Mixer energy and aeration, heat-transfer path, batch versus continuous operation, deposit geometry, ingredient-lot variation, cooling, packaging, sanitation, and inspection capability all belong in the review.
Evidence Escalation Gate
Evidence packet field
Ready for review when
If missing or unstable
Target and reference
Texture language and approved physical sample are both identified
Align the target before selecting a system
Formula and ingredient boundary
Revision, suppliers or lots, and allowed variation are recorded
Repeat with representative inputs
Mixed-mass and deposit condition
Density/appearance, hold, mass, and geometry are defined
Identify which state the equipment must reproduce
Thermal, cooling, and package window
The relevant histories and evaluation time are bounded
Map the missing post-oven conditions
Measurement system
Method, sampling, references, repeatability, and owner are stated
Qualify the method before comparing systems
Scale-change risks
Mixing, heat, geometry, operating mode, sanitation, inspection, and packaging deltas are listed
Design a pilot that tests the unresolved deltas
Disposition and sign-off
Result, deviations, open risks, owner, and next decision are visible
Keep the trial open; do not claim readiness
Once complete, the guide can be cross-referenced with the page on baking science for industrial texture control to answer some of the production and automation related questions within their proper commercial context. This diagnostic guide isn’t the appropriate location for addressing capacity, utilities, equipment, calculators, costs, or quotes.
Frequently asked questions
What are the seven major ingredients in baking?
Read the answer
Many teaching lists contain flour, liquid, sugar, fat, eggs, salt, and a leavening system, but the counts are specific to the product. For troubleshooting, function groups are more useful than a fixed list. Consider what builds structure, manages water, tenderizes, generates or retains gas, and supports emulsification. One ingredient can serve several functions, so context will help.
What is the 1-2-3-4 rule in baking?
Read the answer
The traditional 1-2-3-4 cake formula uses 1 cup butter, 2 cups sugar, 3 cups flour, and 4 eggs. It is a household formula, not a mass ratio, production specification, or standardized texture target. Flour characteristics, egg size, fat state, mixing method, pan or deposit geometry, oven profile, and target texture can all change the outcome. For a controlled trial, record the weighing basis, exact formula, approved reference, process conditions, and measured response before changing the formula. The mnemonic can explain one recipe family, but it does not establish a factory tolerance or a safe substitution rule. Use it as historical context, not as a diagnostic shortcut.
How do different baking ingredients inform texture diagnosis?
Read the answer
Flour proteins and starch help build and set structure, while liquids hydrate components. Sugar alters sweetness, spread, water behavior, and browning. Fat influences tenderness, lubrication, and aeration. Eggs contribute water, proteins, lipids, and emulsifying components. Acids and leaveners affect reaction conditions and gas production. These functions overlap, so ask what the ingredient does in this formula, dose, mixing sequence, geometry, and heat profile, then treat the answer as a texture hypothesis rather than a diagnosis.
How is water activity different from moisture content?
Read the answer
The moisture content refers to a product’s water content considering a specific defined method. Water activity describes equilibrium vapor-pressure behavior relative to pure water under the same conditions. They both address different issues. It’s necessary to consider the method, temperature, sample condition, and product context when interpreting both moisture content and water activity data. Do not turn either reading into a safety or shelf-life claim.
Why can more leavener fail to create more volume?
Read the answer
An exact amount of gas generation won’t guarantee retention of gas until structure is formed. Viscosity, incorporated-air cells, mixing, deposit handling, reaction timing, geometry, heat transfer, starch changes, and protein setting all affect the final cell structure. Additional leavener can therefore change spread, cell size, surface behavior, alkalinity, or flavor without delivering the intended volume. Start by separating four observations: the condition of the mixed mass, expansion during baking, the final cell distribution, and any collapse during cooling. If gas forms but cells coalesce or collapse, increasing the leavener may intensify the symptom. If little expansion occurs, factors such as ingredient identity and activity, dispersion, acid balance, delay before baking, and thermal timing become different hypotheses to consider. Hold unrelated variables steady and compare the suspected mechanism against the approved reference; do not diagnose from final height alone.
How do I know whether a bench trial is ready for scale-up?
Read the answer
A bench trial can be moved to a review of a production system when the target, reference, formula, ingredient boundaries, geometry, process window, measurement system, repeat evidence, deviations, and open risks have been documented. Next, the changes in scale for mixing, heat, operating mode, cooling, packaging, sanitation, and inspection are documented. The review is used to determine a pilot; success in the laboratory isn’t an assurance of success in scale-up.
Turn a texture problem into an evidence packet
Baking science isn’t a recipe containing set results for each ingredient. Baking science is about using an observed result to make a justified and defensible decision. Describe the symptom, keep competing formula and process causes visible, select a measurement that can distinguish them, and run a design that matches the question. Run the appropriate design to answer the question. When interactions are plausible, test interactions. Where necessary, record the specific measurement conditions.
Together, three tools make that discipline visible: the Texture Failure Triage Matrix prevents premature certainty, the One-Question Texture Trial Record protects the comparison, and the Evidence Escalation Gate exposes missing scale-change evidence. These tools assist in documenting a complaint of “wrong texture” without the assumption that a single ingredient, a single measurement, or a single bench-scale batch will give the answer.
How this guide was built
The guide integrates sources that include government publications, peer-reviewed articles, experiment-design guidance, and university resources for scale-up. The matrices are editorial decision aids, not standards, client trial results, or equipment-performance claims. Company-history, investment, land-area, patent-ownership, and market-leadership statements were deliberately excluded because this guide’s evidence set did not independently establish their ownership or scope.
UDTECH has been manufacturing food machinery since 2003. This is where we write down what we learn from product samples, trial runs and commissioning—the batter, the bake and the texture, rather than the sales sheet.
These guides help production managers, buyers and food entrepreneurs work through batter faults, sample runs, output targets and factory acceptance. When a question turns into an equipment question, the same enquiry form reaches our engineers.
OUR EXPERIENCE
Food machinery manufacturing since 2003, with practical experience from product samples, trial runs and commissioning across egg roll, wafer, waffle, biscuit and snack production.
OUR EXPERTISE
We work from real recipe and output conditions, covering process, product and machine specification questions. Technical enquiries are passed to the engineer responsible for that equipment.