Flour moisture content is the water fraction of flour, expressed as a proportion of the total mass. Verify the identity, reporting basis, and measurement method of the sample prior to altering a recipe. Checks of that nature indicate if two numbers provided relate to different lots of flour, or if they simply differ in how they’re reported.
Updated October 2026
Lots with different moisture contents deliver different dry solids to a mixer. A drier delivery will also bring more dry flour solids to a mixer, but at the same bag weight. Adding water can correct one part of that change while leaving another untouched. For food industry production and purchasing teams, the useful question is which quantity must stay constant: flour weight, dry solids, total water or a measured dough response.
Worked out batches and prices shown below are solely illustrative and don’t denote customer trial results or financial quotations.
What flour moisture content measures
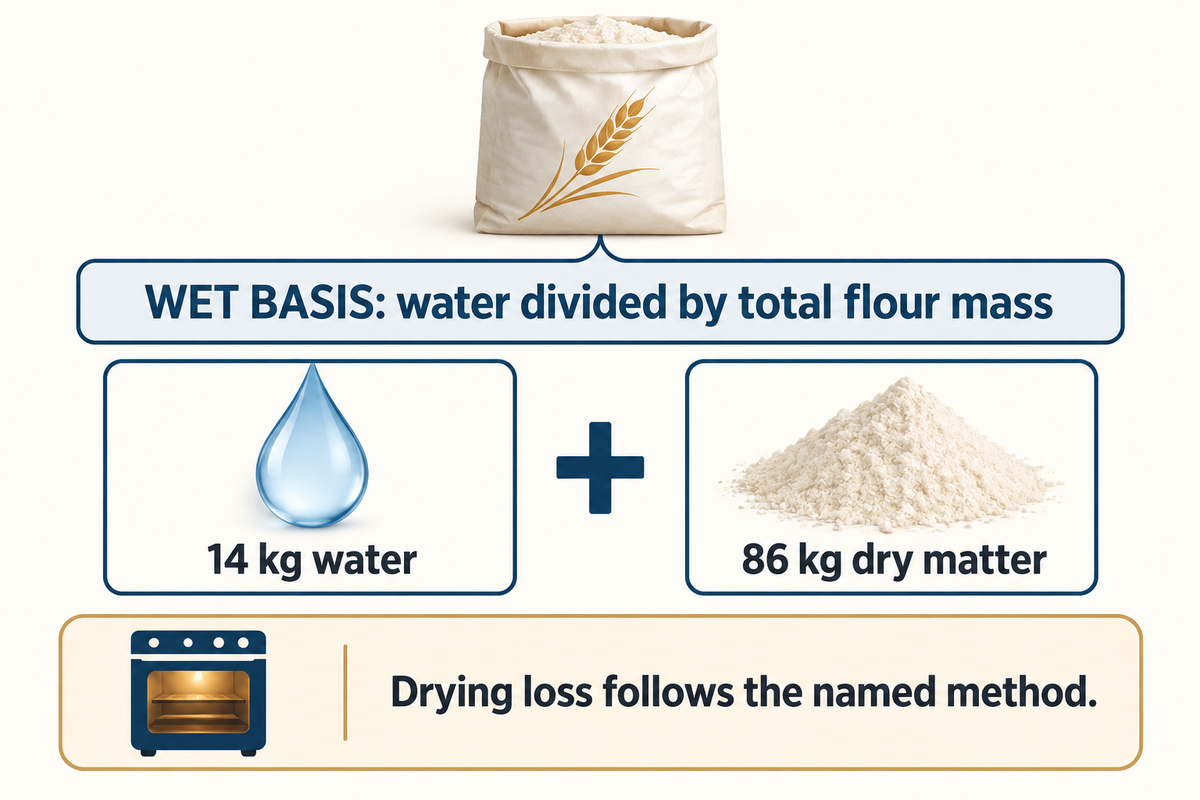
On a wet basis, the moisture of flour is determined by dividing the mass of water by the mass of the sample, then multiplying by 100. The remainder is dry matter. Therefore, moisture content analysis requires a reporting basis and determination method, particularly when a laboratory determines water by means of the mass of the sample lost during drying.
Purdue University’s wet-basis definition uses the total material weight as the denominator. For a 100 kg lot at 14% moisture, the mass balance is 14 kg water and 86 kg dry matter. Protein content, starch content and fat content describe parts of that dry matter. Those descriptions depend on the chemical composition and the basis of reporting. Compare the principal components on the same reporting basis.
How do you calculate moisture from a dried sample?
To determine the percentage of moisture lost, subtract the final sample mass from the initial sample mass. Divide the mass lost by the initial sample mass, and multiply by 100. Exclude the container from both sample masses. Using a hypothetical 5.00 g test portion that lost 0.65 g, the calculation would be 0.65 ÷ 5.00 × 100 = 13.0%.
That result is applicable to the drying method used. Loss on drying may include substances other than water, so a precise measurement requires the specified apparatus and endpoint. The explanation of moisture by the American Society of Baking discusses both drying and calibrated rapid measurements. A kitchen-scale weight change is inappropriate to settle a mill certificate dispute.
In the 5.00 g example, dividing the 0.65 g loss by the 4.35 g residue would give 14.94%, not 13.0%. Record wet basis or dry basis beside the percentage before anyone uses it to change a batch. Follow the notations for wet-basis and dry-basis throughout the mill and bakery records.
Compare wheat flour lots on the same basis
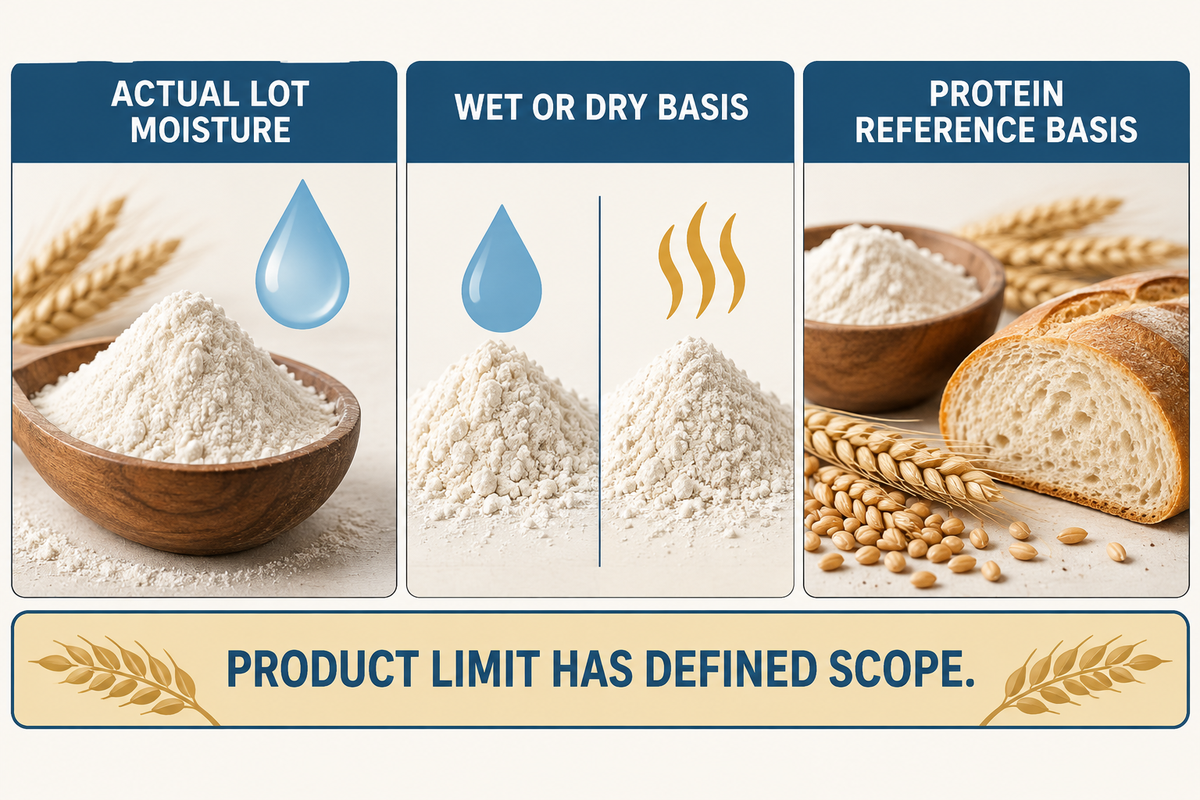
A better comparison of milled flour separates “measured moisture” from a basis used to report some other constituent. Moisture is expressed on a wet or a dry basis and can be mathematically converted. Protein, reported on a standard moisture basis, describes the normalized composition of the product. It doesn’t convey the amount of moisture, or water content, in the delivered lot.
Purdue’s dry-basis definition divides water by dry matter. Thus 14% wet-basis moisture becomes 14 ÷ 86 × 100 = 16.28% dry basis. The flour hasn’t picked up water. Reversing the conversion gives 16.28 ÷ 116.28 × 100, approximately 14% wet basis.
The Canadian Grain Commission’s wheat testing methods generally report flour and semolina analytical results at 14.0% moisture, unless another basis is specified. Its alveograph results use a 15% basis. Copy the basis for the particular test rather than assigning 14% to every result on the certificate.
If protein is 12.0% as received in a lot containing 12.0% moisture, a dry-matter conversion gives 12.0 ÷ 0.88 = 13.64% protein on a dry basis. Reporting that composition at 14% moisture gives 13.64 × 0.86 = 11.73%. These are hypothetical conversions of one composition, not three different protein tests.
Product limits are a different issue. The current U.S. 21 CFR 137.105(a) sets moisture at no more than 15% for the flour it defines, made from wheat other than durum and red durum. Apply the defined product scope; neither the CGC’s 14% reporting basis nor its 15% alveogram basis is that U.S. composition limit.
Two certificates reading 14% wet basis and 16.28% dry basis can both describe the same water-to-solids balance. Two lots both labeled “protein at 14% moisture” can still arrive at different measured moisture. Converting the reporting basis cannot reconcile an oven result with an analyzer reading. Compare a shared sample using an agreed reference method before adjusting the recipe. When comparing delivered dry solids, a purchaser needs the actual lot moisture result as well as the composition basis.
Measuring moisture: oven methods and the analyzer
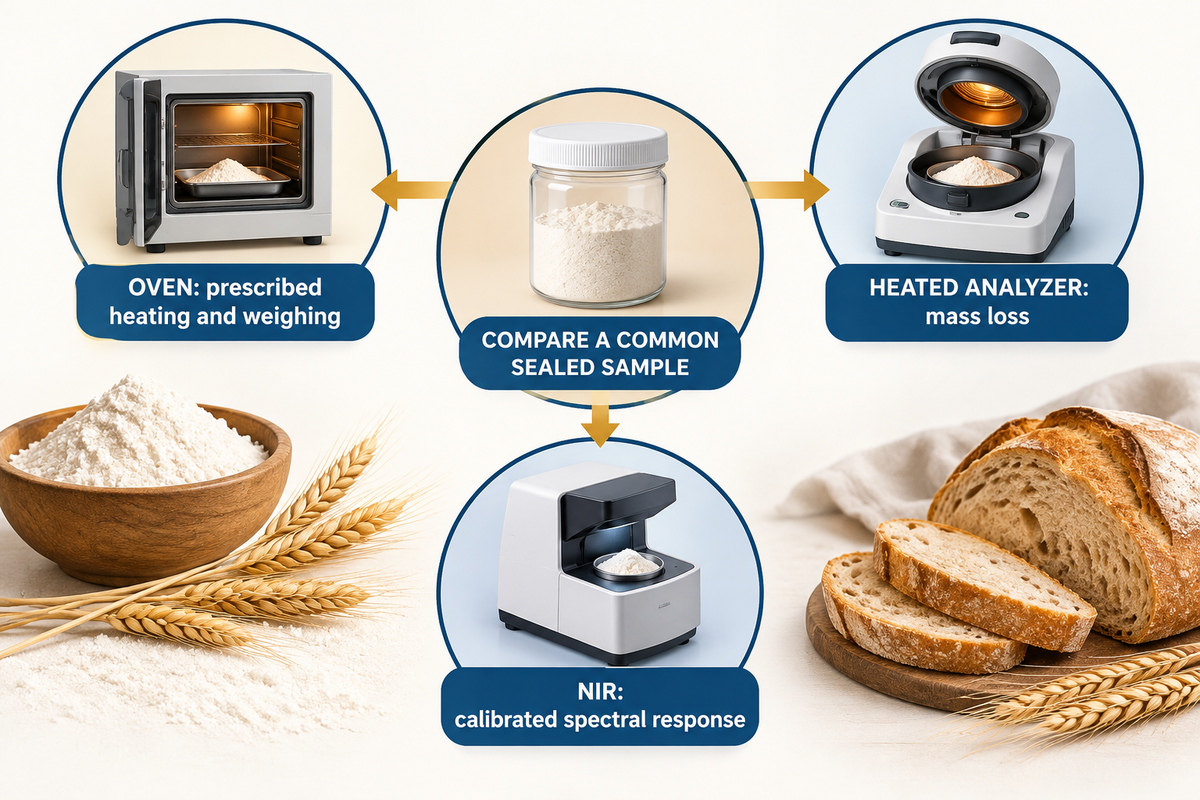
To measure the moisture reliably, start with a method of measurement appropriate for the sample and decision. Sample preparation for moisture determination needs to be consistent. Oven loss, a heated moisture analyzer and near-infrared measurement produce results through different mechanisms. Compare their sample preparation, calibration, and reporting basis, and only then can differences in flour be considered.
In an oven test, the sample is heated and weighed following the prescribed procedure. A halogen moisture analyzer also follows a mass-loss approach. NIR determines composition from a calibrated spectral response. A rapid reading is useful only within the validated sample range. Representative calibration and maintenance are stressed in Chen’s handheld NIR study on wheat flour.
The ISO public catalog identifies ISO 712-1:2024 as a routine reference method for specified cereals and cereal products, including wheat flour (excluding maize and pulses). CGC mentions AACC 44-15.02 (or a calibrated Brabender procedure) for determination of flour moisture. For the U.S. flour identity rule, paragraph (c)(3) instead incorporates specified sections of the AOAC 13th edition vacuum-oven method. The named purpose determines the method to be used.
| Measurement or calculation | What it describes | Use in a lot comparison |
|---|---|---|
| Wet-basis moisture, % | Water relative to total flour mass | Calculate incoming water and dry solids |
| Dry-basis moisture, % | Water relative to dry matter | Convert the denominator before comparing |
| Protein at 14% moisture | Composition on a stated reference basis | Keep the actual lot moisture separately |
| Oven loss, % | Mass lost under a named drying program | Match preparation, endpoint and method |
| Heated analyzer result, % | Instrument-specific drying measurement | Check its reference comparison |
| NIR moisture, % | Calibrated spectral prediction | Confirm flour types covered by calibration |
| Farinograph absorption, % | Water for a specified dough consistency | Assess functional response separately |
| Solvent retention capacity, % | Retention under a defined solvent test | Select the solvent/test for the property |
| Baker’s hydration, % | Recipe liquid relative to flour weight | State the recipe counting convention |
Suppose a certificate says 13.6% and an in-house unit says 14.0%. The 0.4 percentage-point difference is a question to investigate, not a reason to average the readings to 13.8%. First compare a common sealed sample using the agreed reference method, then evaluate the difference against the laboratory’s uncertainty and acceptance rule.
Flour water absorption is a separate test
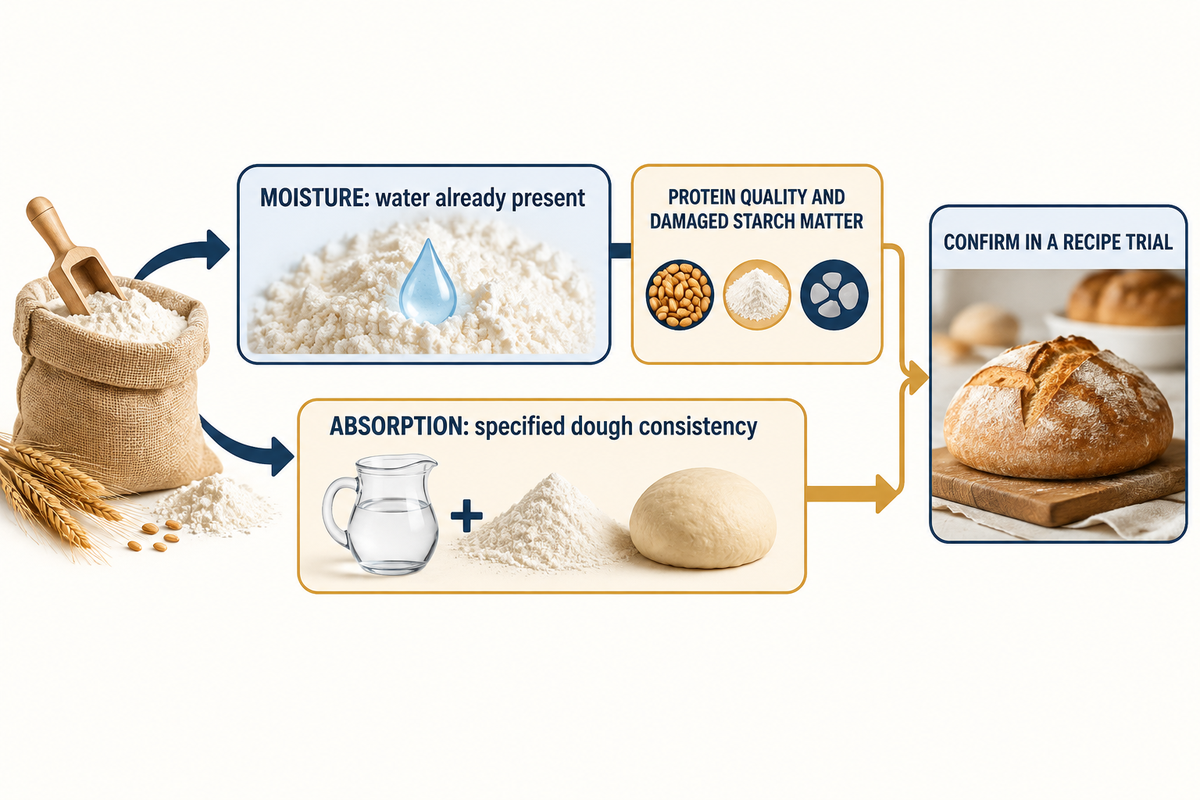
Flour has a water absorption response under specified test conditions, which varies by protein quality, damaged starch and other constituents, whereas moisture content describes water already present. Equal moisture percentages therefore leave room for different rheological properties, even when two recipes start with the same flour and added-water weights.
“The farinograph measures how much water is needed to make dough of a specific consistency.”
In Barak and colleagues’ particle-size study, the materials and methods describe two wheat cultivars separated into three size fractions. Particle size had no substantial effect on their moisture content, yet damaged starch and solvent retention changed. The milling process can damage native starch granules as well as change the particle size distribution. Reading only moisture would miss those physicochemical properties. The physical properties that affect mixing need their own characterisation.
Does lower moisture always mean higher flour hydration capacity?
Lower moisture means more dry matter per kilogram of otherwise comparable flour. However, it doesn’t rank every flour’s functional hydration capacity. Hard wheat bread flour, all-purpose flour and soft wheat flour can differ in protein quality and starch damage. Choose a functional test for the dough or batter that you want, and confirm the response in a recipe.
The USDA Soft Wheat Quality Laboratory notes difficulty evaluating gluten strength by mixograph or farinograph in soft wheat flours with protein at 8.5% and below. It identifies lactic-acid solvent retention capacity as a measure of protein quality in that context. Water retention and farinograph absorption remain different measurements, even when they correlate. The laboratory also links water-soluble arabinoxylans with sucrose retention, which is another reason to name the solvent in an SRC result.
Senay Simsek’s discussion of water mobility in flour and dough explains why composition and water distribution matter together. For a product that has become tough, connect the lot record to mixing conditions using the pancake mixing and gluten guide. Excess water can also help hide a mixing problem; water isn’t the only variable that can be changed.
A soft-wheat result at 8.5% protein calls for attention to the purpose of the functional test, not an automatic water addition. A plant manager can retain batch mass, while the quality team chooses a relevant retention or dough test. Finished texture still needs a controlled bake with the intended ingredients.
A flour hydration correction with the solids held constant
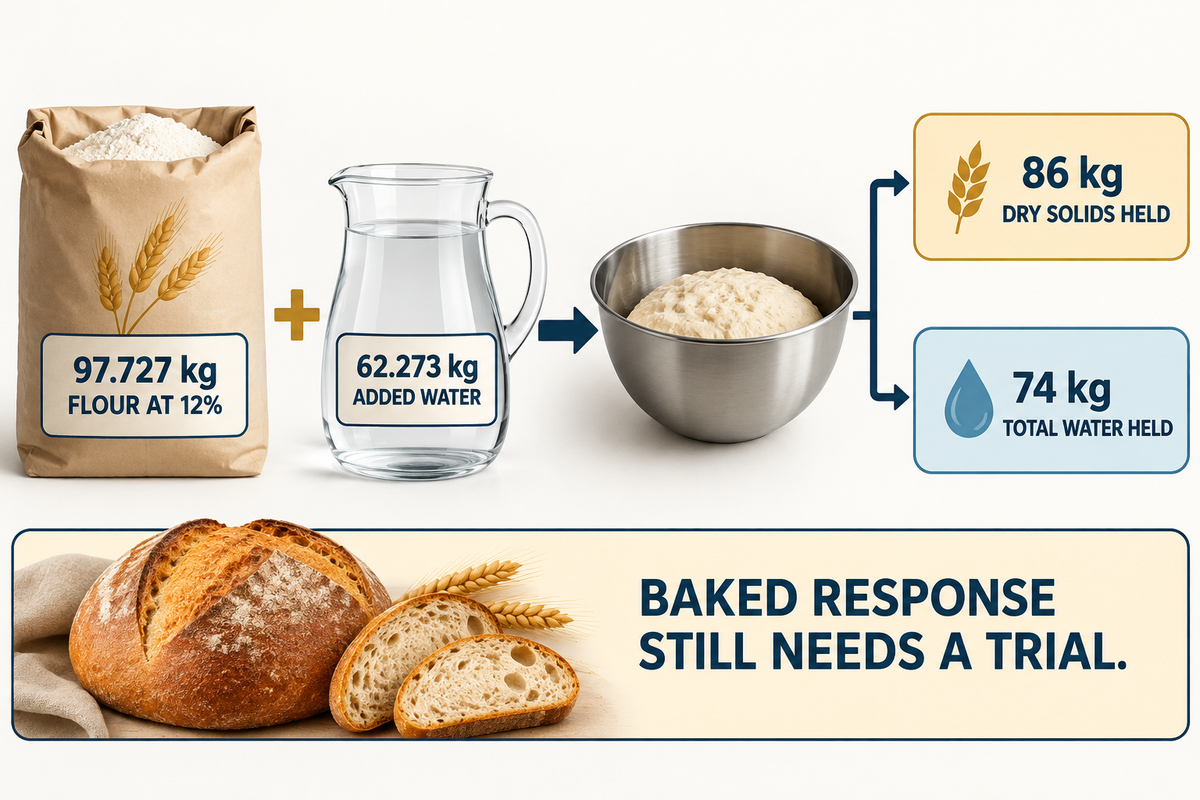
To conserve the total dry solids and total water, the mass of flour needs to be recalculated before water is added. At a fixed flour weight, a water adjustment alone doesn’t automatically conserve both dry solids and total water. The mass balance statement maintains the total water and total dry solids, while the flour changes from 14% to 12% moisture.
The Basis-to-Batch Reconciliation starts from 100 kg flour at 14% moisture plus 60 kg added water. Dry solids are 100 × 0.86 = 86 kg. Total water is 14 + 60 = 74 kg. With 12% moisture flour, the required flour mass is 86 ÷ 0.88 = 97.727 kg.
That new flour contributes 97.727 × 0.12 = 11.727 kg water. Added water becomes 74 − 11.727 = 62.273 kg. The method follows the dry-matter conservation explained by UF/IFAS in its moisture-adjusted mass calculation; its agricultural example supplies the arithmetic principle, while the bakery inputs here are hypothetical.
| Quantity | Reference | Hold solids and water | Keep 100 kg flour |
|---|---|---|---|
| Incoming moisture | 14% | 12% | 12% |
| Dry fraction | 0.86 | 0.88 | 0.88 |
| Flour mass | 100.000 kg | 97.727 kg | 100.000 kg |
| Dry flour solids | 86.000 kg | 86.000 kg | 88.000 kg |
| Water carried by flour | 14.000 kg | 11.727 kg | 12.000 kg |
| Added water | 60.000 kg | 62.273 kg | 62.000 kg |
| Total water | 74.000 kg | 74.000 kg | 74.000 kg |
| Combined mass | 160.000 kg | 160.000 kg | 162.000 kg |
| Water per kg dry solids | 0.8605 kg/kg | 0.8605 kg/kg | 0.8409 kg/kg |
A trial operator choosing the third column weighs less flour and more added water. Keeping 100 kg flour instead produces 2 kg extra dry solids, even though total water stays at 74 kg. Decide which basis the recipe specification requires before weighing; otherwise a water correction quietly becomes a solids change.
In one equipment context, the baking of small round baked wheat-flour snacks on a mini biscuit baking line is an example where trial water additions and flour lots should be recorded together. Adjust the water balance during the trial, and check the forming and the baked product.
86 kgDry solids held constant
74 kgTotal water held constant
160 kgCombined flour and water
Other ingredients also provide water and dry matter. Keep the other ingredients constant, or also extend the balance to each ingredient for this comparison of flour only. A change in the grade of maltodextrin or egg/syrup also creates a change in the ingredient system. Use the baking ingredient functions guide to set these separately.
Storage conditions can change the sample
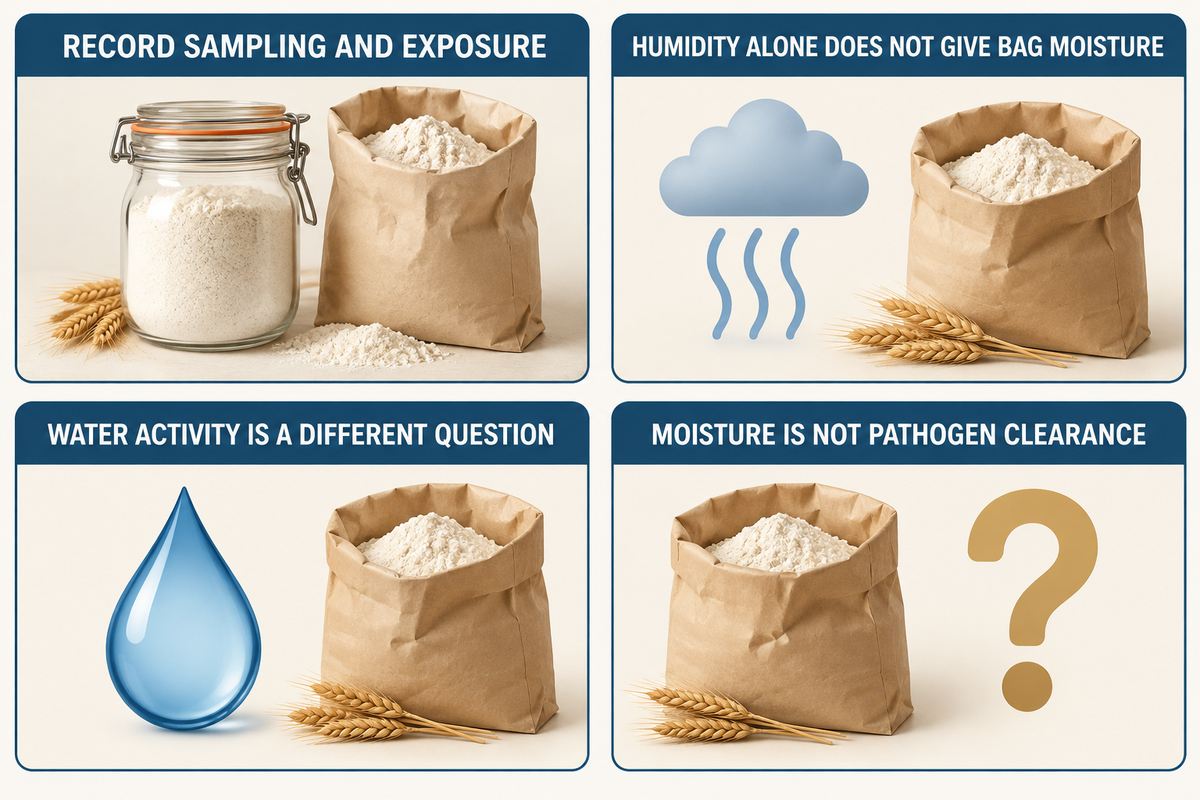
The test reflects the condition of the sample at the time of sampling. Alterations in water mass and total mass are caused by changes in moisture content. Maintain sampling date and container history with the result, particularly when a sealed delivery sample is compared to flour that’s exposed during production.
Han and colleagues’ wheat-flour sorption study examined six flours under different temperatures and equilibrium relative humidities. Variability in the test conditions impacted the result. Therefore, a humidity reading by itself can’t determine the current moisture percentage in a bag of flour.
If the hypothetical 100 kg, 14% lot gains 2 kg water with no dry-matter loss, it now contains 16 kg water in 102 kg total. The final moisture is 16 ÷ 102 × 100 = 15.69%, not 16%. For flour covered by the U.S. 15% identity limit, that high moisture value also raises a specification issue; the example isn’t a storage target.
Water activity influences storage behavior in a different way than moisture. A 2015 paper by Carter and colleagues, including instrument-company and milling-company authors, relates stability more closely to water activity than to moisture alone. The FDA also notes that milling raw grain does not kill harmful bacteria. A moisture result is not a pathogen-clearance result.
In the 102 kg example, the original 86 kg dry matter remains unchanged. Quality control should retain the original and exposed-sample records as different sampling conditions, then retest the relevant lot. Production should connect that history to baking moisture and texture control, rather than assigning a shelf life from one moisture result.
Compare flour prices per kilogram of dry solids
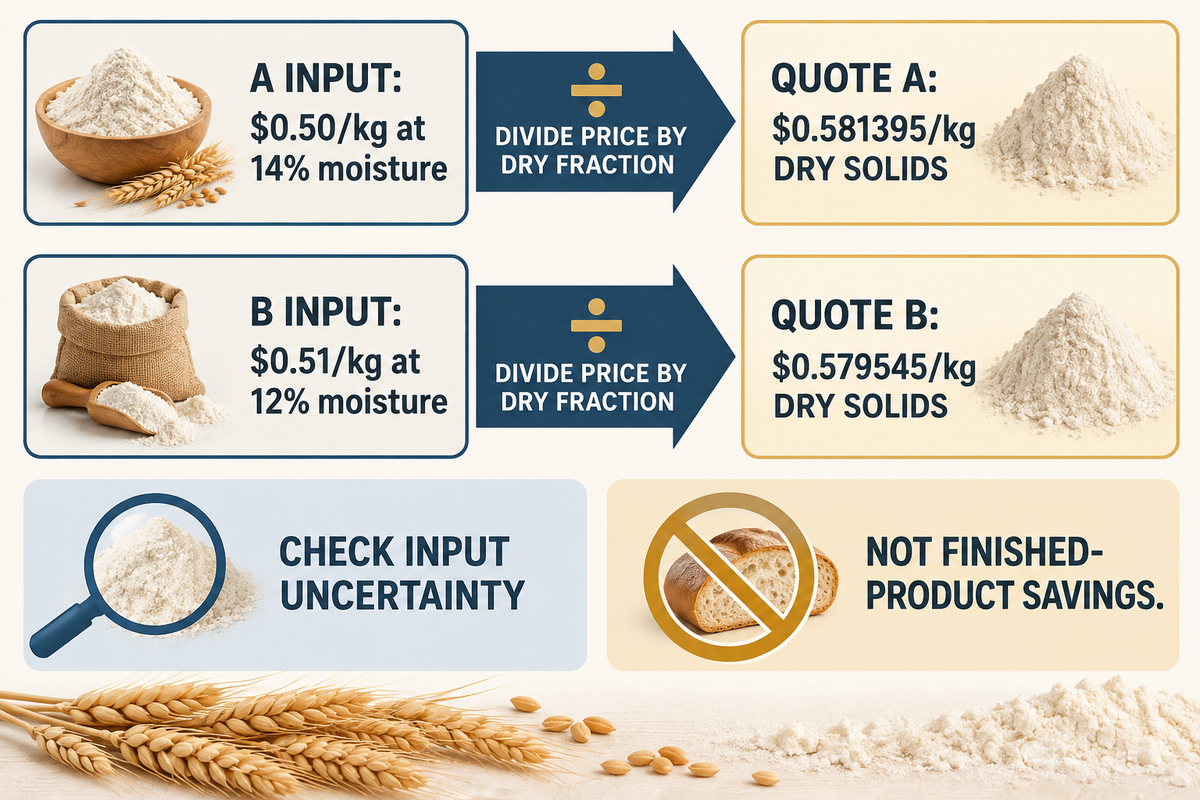
Divide the as-received price by the flour dry fraction to compare cost per kilogram of dry solids. Keep delivery terms and quality requirements the same. A higher wet-weight quote can become a lower dry solids quote, but a calculated slight edge deserves a sensitivity check before purchasing treats it as a saving.
The Dry-Solids Quote Comparison uses $0.50/kg at 14% moisture for A and $0.51/kg at 12% for B. A costs 0.50 ÷ 0.86 = $0.581395/kg dry solids. B costs 0.51 ÷ 0.88 = $0.579545/kg dry solids, about 0.32% less. Freight and other charges are excluded from both inputs.
| Comparison | Quote A | Quote B |
|---|---|---|
| As-received price | $0.50/kg | $0.51/kg |
| Measured moisture input | 14.00% | 12.00% |
| Dry solids per 100 kg | 86 kg | 88 kg |
| Price per kg dry solids | $0.581395 | $0.579545 |
| B moisture at equal dry-solids cost | Other A inputs fixed | 12.28% |
At 12.28% moisture, B’s dry-solids price equals A’s if all other inputs stay the same. That 0.28 percentage-point change is a calculated break-even point, not an allowable analyzer tolerance. Refer to NIST’s discussion of uncertainty propagation to understand why derived quantities retain input uncertainty. Ask if representative sampling and measurement can address this apparent advantage.
B can be shortlisted based on dry-solids arithmetic by purchasing, and the baked yield and rejects can be compared by the plant team based on the intended recipe. Different protein quality, storage history or delivery charges can outweigh $0.00185/kg dry solids. Keep the normalized quote and compare against costs. Don’t interpret the 0.32% difference directly into finished product savings.
Flour testing outlook: methods and mill comparisons
Method editions and product testing should inform the next flour specifications review. Since the publication of ISO’s Moisture standard in 2009, ISO 712-1:2024 has taken its place. Simultaneously, in more recent trade discussions, the focus has been on the functional performance and the composition of goods. A mill comparison needs an agreed measurement purpose before the buyer chooses either a reference method or a faster instrument.
The withdrawn ISO 712:2009 catalog entry identifies its successor. For a new specification, name the selected edition and encompassed material, then describe the difference between a routine receiving measurement and a method embedded in a product rule. A newer edition of ISO does not automatically replace the methodology of a regulation or an agreement that is already in place.
In a July 2026 Bakery&Snacks interview about flour specifications, KPM’s Arnaud Dubat discusses the gap between conventional test numbers and performance. From an equipment supplier’s perspective, the question is: which property needs testing for this product? Asking this question should lead to a specified trial rather than an assumption that a new instrument solves all formulation problems.
What should the mill provide when results disagree?
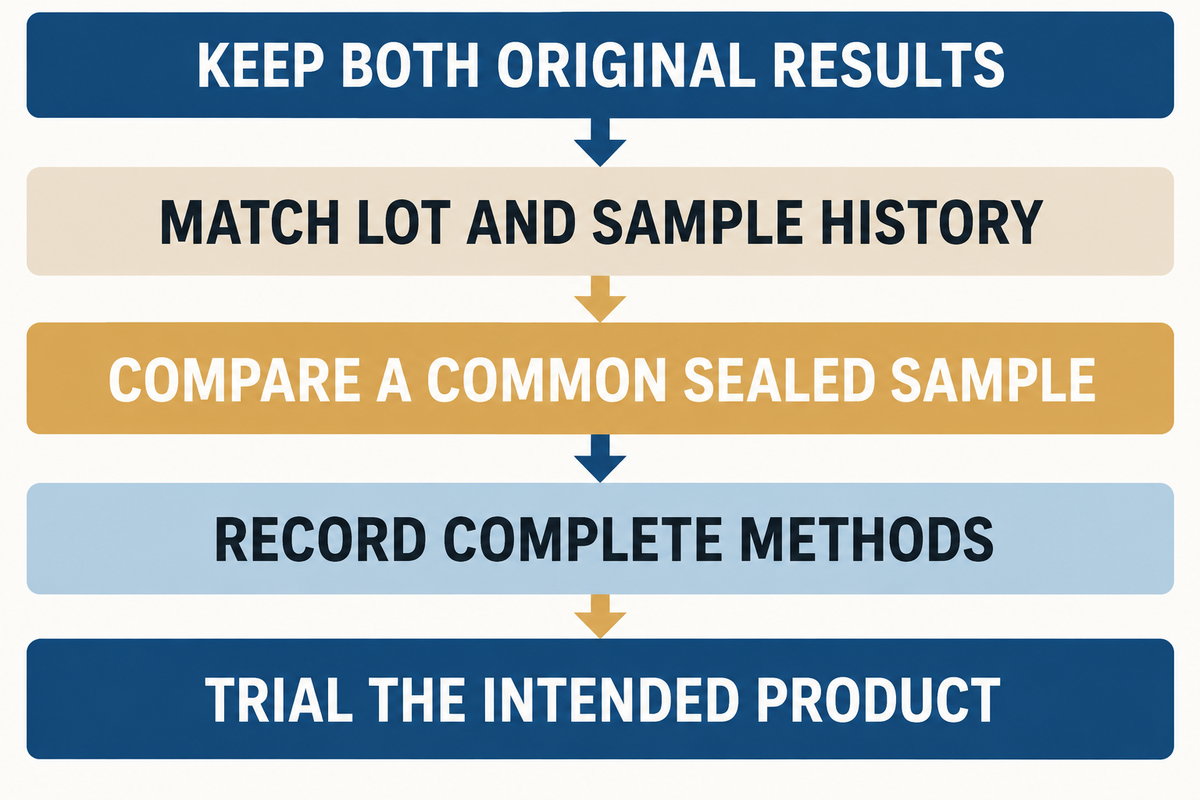
The mill should include the sampled lot, sampling date, basis of measurement of the moisture content, and a complete reference to the method. Then, it should describe how the result of the test can be compared to the analyzer of the buyer. For a 13.6% versus 14.0% disagreement, use a shared sample and an agreed reference test before deciding whether the lot or the measurement system needs attention.
| Field | Supplier certificate | Bakery result | Next action |
|---|---|---|---|
| Moisture result | 13.6% | 14.0% | Keep both original values |
| Lot identity | Lot A stated | Opened production bag | Confirm both samples belong to Lot A |
| Reporting basis | Not recorded in example | Wet basis | Obtain the certificate basis |
| Method and edition | Not recorded in example | Heated analyzer program | Record both complete methods |
| Sampling date and exposure | Sealed retain | Exposure history incomplete | Compare a common sealed sample |
| Calibration and uncertainty | Not recorded in example | Not recorded in example | Obtain laboratory comparison data |
Quality leads should be able to provide this comparison record with retained samples. Purchasing can keep the decisions on the lot and the commercial quote separate. The production manager should record the amount of water actually added and the processing stage at which behavior changed, and should refer to the batter and texture troubleshooting guide to decipher the observations.
Key takeaway
The worked correction preserves 86 kg dry flour solids and 74 kg total water. Basis, sample and method checks make the calculation usable; a recipe trial determines the dough rheology and baked-product response.
For a production trial with UDTECH, bring the flour lot results and a recipe record that separates flour-carried water from added water. The baking science and ingredient texture guide is to be utilized to describe the finished texture being assessed. The flour comparison should be tied to the product target.
Frequently asked questions
How do you calculate flour moisture percentage?
Divide the measured water loss by the original flour sample mass and multiply by 100 for a wet-basis result.
Use sample masses after subtracting the container tare, and follow the named drying method. A 5.00 g sample losing 0.65 g gives 13.0% on this basis. Dividing by the dried residue instead gives a dry-basis value, so the two percentages should carry different labels. Compare repeat results only after confirming the same preparation and drying procedure; changing the endpoint changes what mass loss is being measured.
Does bread flour always contain more moisture than all-purpose flour?
No; bread flour and all-purpose flour labels do not determine the measured moisture of a delivered lot.
Use the lot’s moisture result for its water fraction and a separate protein or functional test for its intended baking use. Whole wheat flour also brings a different composition. Keep the whole-wheat grade name on the sampling record. Comparing higher protein with lower moisture as if they were opposite ends of one scale confuses separate physical and chemical properties. The flour mill can report both values without treating one as a substitute for the other.
Which AOAC method applies to flour moisture?
For the U.S. flour identity rule in 21 CFR 137.105, paragraph (c)(3) names the incorporated AOAC vacuum-oven method.
The text refers to the 13th edition (1980), sections 14.002 and 14.003. Other laboratory specifications can name different methods, including those listed by the Canadian Grain Commission. Record the purpose and full reference instead of combining drying temperatures or times from unrelated procedures. The full procedure must also specify sample preparation and the measurement endpoint used for that purpose.
Does finely ground flour always absorb more water?
No; particle size alone is insufficient to predict water absorption.
Starch damage and protein characteristics also matter. Barak’s study found different retention behavior across fractions without a substantial moisture difference.
Can a flour hydration chart replace a trial?
A hydration chart can organize recipe ratios, but the intended flour and product still need a trial.
King Arthur Baking’s hydration explanation distinguishes the recipe calculation from how different flours behave. Baker’s hydration commonly counts recipe liquids against flour weight; the mass balance in this article also counts water carried inside the flour. State which calculation you’re using.
For the worked 100 kg reference, a 12% moisture replacement can be adjusted to preserve 86 kg dry solids and 74 kg total water. That fixes the mass inputs. It doesn’t fix gluten development, enzyme activity, other enzymatic changes or finished textural characteristics. Keep how you mix or knead the dough and the rest of the formula controlled, record the response, and adjust the trial based on the product rather than a generic high-water target.
References & Sources
- Purdue University: moisture content on a wet basis; dry-basis definition.
- American Society of Baking: Moisture in Flour.
- Canadian Grain Commission: methods and tests for wheat; Measuring flour water absorption.
- Electronic Code of Federal Regulations: 21 CFR 137.105, Flour.
- Chen and colleagues, 2021: handheld near-infrared analysis of wheat flour, public abstract.
- International Organization for Standardization: ISO 712-1:2024 public catalog; ISO 712:2009 withdrawal and replacement record.
- Barak, Mudgil and Khatkar: flour particle-size and solvent-retention study.
- USDA Agricultural Research Service, Soft Wheat Quality Laboratory: Flour Tests
- Senay Simsek, 2026: Understanding water mobility and distribution in flour and dough
- University of Florida IFAS Extension: moisture-adjusted yield and dry-matter calculations.
- Han and colleagues, 2017: Wheat-flour Moisture Sorption Public Abstract
- Carter and colleagues, 2015: The case for water activity as a specification for wheat tempering and flour production
- U.S. Food and Drug Administration: Handling Flour Safely.
- Antonio Possolo, NIST, 2020: Evaluating, Expressing, and Propagating Measurement Uncertainty for NIST Reference Materials
- Bakery&Snacks, July 2026: flour specifications and baking performance, interview with KPM’s Arnaud Dubat
- Martin Philip, King Arthur Baking, 2023: Bread hydration.